CRIC DataView
The CRIC Study has compiled a rich collection of information describing the physiological nature of chronic renal disease across a wide variety of individuals who were enrolled in phases 1 & 2. The Study is offering the CRIC DataView tool as a resource for sharing this vast knowledge with anyone interested in exploring in greater detail how this chronic disease affects the body.
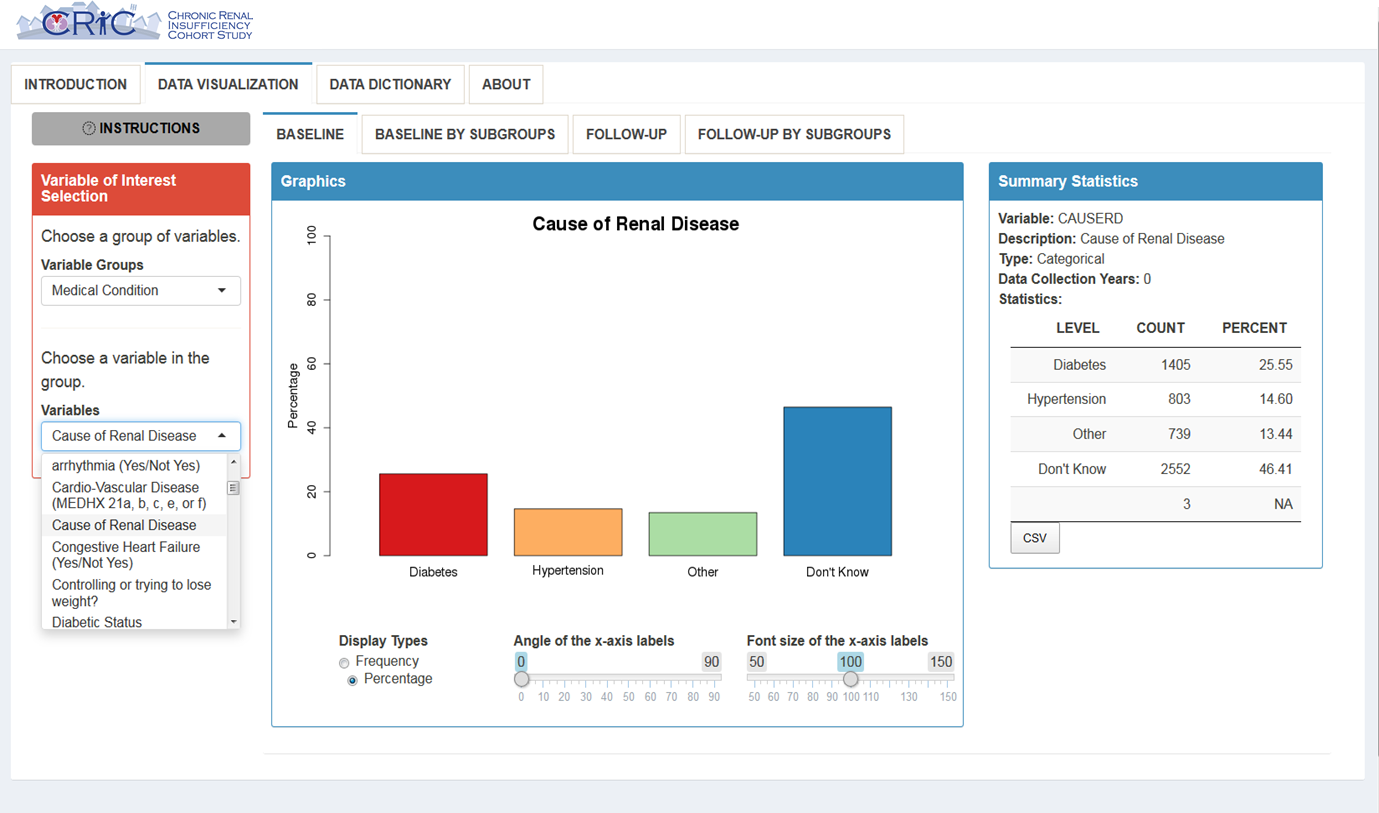
CRIC DataView will display a number of selection fields for each of the options available for defining a query. The example plot below shows the basic layout of the tool. Cohort data for categorcal or continuous variables can be viewed relative to the baseline visit or longitudinally across visits. Data can also be split into subgroups. Up to three subgroups can be defined based on a list of defined variables.
CRIC DataView is available for all to use. In order to start CRIC DataView, please click on the link below or use the menu on the left. CRIC DataView will require you to provide your name and email address in order to launch the tool. This information will be used internally to understand usage.
Investigators should cite CRIC DataView as the source and include a link to the site when presenting or publishing on results based on data obtained from CRIC DataView.